
Salut tout le monde, j’ai écrit à peu près exactement le même article la semaine dernière sur les jeux parfaits, et je voulais continuer cela pour les no-hitters.
J’ai utilisé le même ensemble de données de jeu parfait de 1920 à 2025, soit 379 815 départs. Nous examinons l’analyse de survie des lanceurs qui ont commencé le match, donc les non-frappeurs combinés sont exclus. Selon la définition de la MLB, un match sans coup sûr doit compter au moins 27 retraits et aboutir à une victoire. Cela nous laisse avec 216 matchs sans coup sûr depuis 1920.
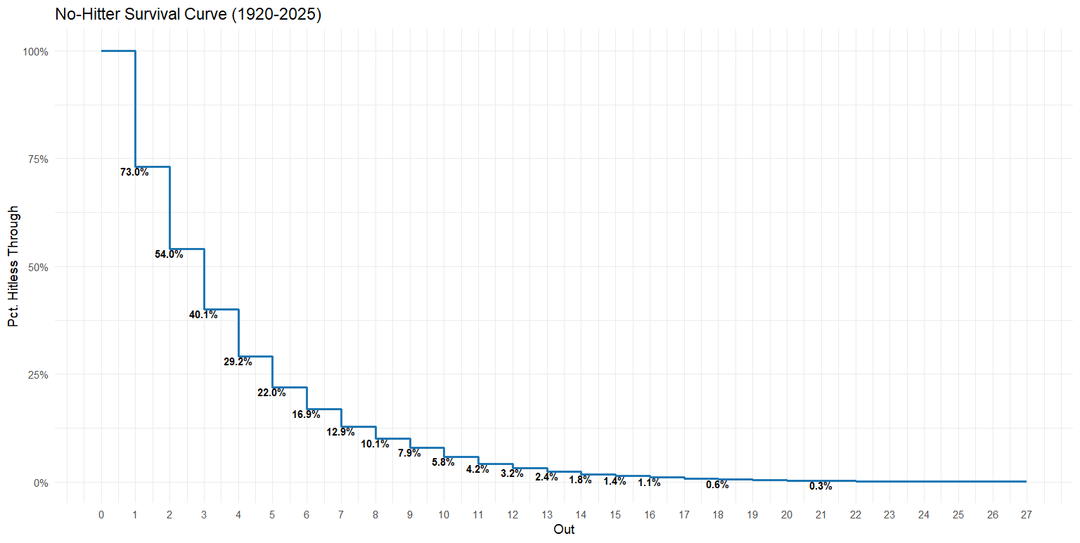
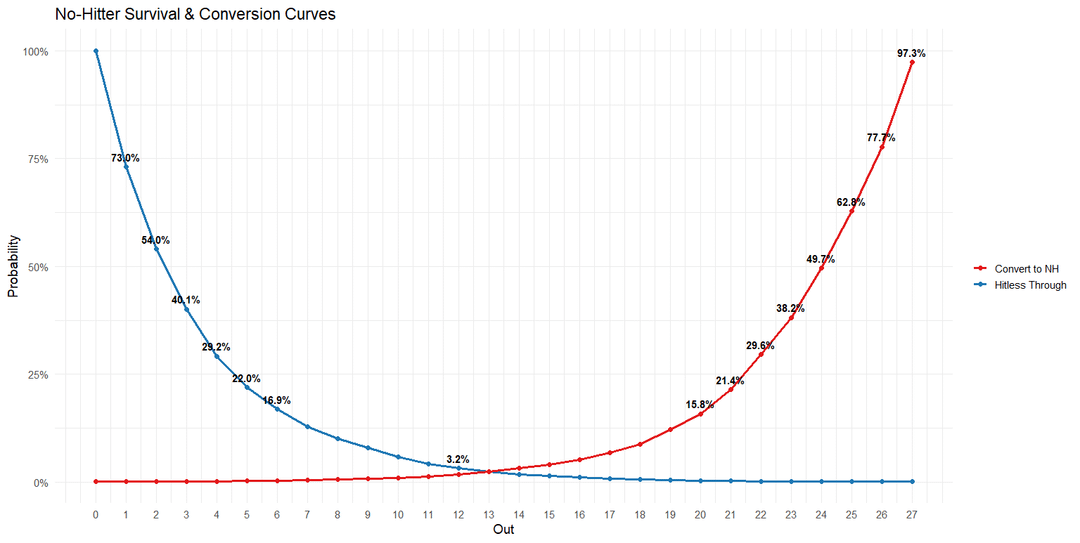
Le tableau ci-dessous comprend les mêmes chiffres que le tableau précédent pour les jeux parfaits afin que vous puissiez comparer à quel point il est plus rare d’être parfait avec x outs plutôt que simplement sans coup sûr (ce qui est extrêmement rare en soi).
| Dehors | % sans succès | % converti en NH | % Parfait jusqu’au bout | % converti en PG | Parmi les % sans succès, combien sont parfaits |
|---|---|---|---|---|---|
| 0 | 100 000% | 0,057% | 100 000% | 0,005% | 100 000% |
| 1 | 73,035% | 0,078% | 65,075% | 0,008% | 89,100% |
| 2 | 53,972% | 0,105% | 43,173% | 0,012% | 79,993% |
| 3 | 40,116% | 0,142% | 27,804% | 0,018% | 69,310% |
| 4 | 29,170% | 0,195% | 18,098% | 0,028% | 62,041% |
| 5 | 21,967% | 0,259% | 12,179% | 0,041% | 55,444% |
| 6 | 16,905% | 0,336% | 8,303% | 0,060% | 49,114% |
| 7 | 12,856% | 0,442% | 5,719% | 0,088% | 44,489% |
| 8 | 10,082% | 0,564% | 4,046% | 0,124% | 40,129% |
| 9 | 7,925% | 0,718% | 3,127% | 0,160% | 39,453% |
| 10 | 5,762% | 0,987% | 2,083% | 0,240% | 36,147% |
| 11 | 4,238% | 1,342% | 1,384% | 0,362% | 32,651% |
| 12 | 3,189% | 1,783% | 0,917% | 0,545% | 28,763% |
| 13 | 2,352% | 2,418% | 0,624% | 0,802% | 26,510% |
| 14 | 1,804% | 3,152% | 0,426% | 1,174% | 23,627% |
| 15 | 1,414% | 4,023% | 0,294% | 1,703% | 20,784% |
| 16 | 1,088% | 5,228% | 0,213% | 2,349% | 19,579% |
| 17 | 0,838% | 6,788% | 0,151% | 3,310% | 18,035% |
| 18 | 0,647% | 8,784% | 0,119% | 4,213% | 18,335% |
| 19 | 0,469% | 12,121% | 0,081% | 6,169% | 17,285% |
| 20 | 0,360% | 15,813% | 0,060% | 8,297% | 16,769% |
| 21 | 0,266% | 21,407% | 0,038% | 13,103% | 14,377% |
| 22 | 0,192% | 29,589% | 0,027% | 18,628% | 13,996% |
| 23 | 0,149% | 38,163% | 0,019% | 26,761% | 12,550% |
| 24 | 0,115% | 49,655% | 0,013% | 38.000% | 11,528% |
| 25 | 0,091% | 62,791% | 0,010% | 48,718% | 11,369% |
| 26 | 0,073% | 77,698% | 0,009% | 57,576% | 11,885% |
| 27 | 0,058% | 97,297% | 0,006% | 90,476% | 9,418% |
Comme la dernière fois, mon attention se porte immédiatement sur le fait que 0,057 % des départs sont sans coup sûr (216/379 815), mais 0,058 % sont sans coup sûr sur 27 retraits. En effet, malgré 216 matchs sans coup sûr, il y a eu 222 départs sans coup sûr en 9 manches. Nous connaissons déjà les départs spéciaux d’Harvey Haddix et Pedro Martinez qui ont été parfaits pendant 9 manches. Quels étaient les quatre autres ?
- Bobo Newsom, le 18 septembre 1934, perd son match sans coup sûr au 10ème manche, quand un simple après deux buts sur balles a abandonné le point gagnant pour faire de Newsom le lanceur perdant.
- Jim Maloney, le 14 juin 1965, a été sans coup sûr pendant 10 manches avant d’abandonner un circuit pour mener la 11e.ème tour de batte. Il a complété le 11ème manche mais a finalement perdu la partie. Je pense que ce qui est le plus impressionnant chez Maloney, c’est lors d’un autre départ en 1965, le 19 août, il a lancé un match sans coup sûr en 10 manches – le seul sans coup sûr en 10 manches dans mon ensemble de données.
- Le 26 juillet 1991, Mark Gardner était sans coup sûr jusqu’au 9 avant d’abandonner un premier coup sûr au 10.ème tour de batte.
- Rich Hill, le 23 août 2017, a été non seulement sans coup sûr, mais parfait pendant 8 manches avant qu’une erreur ne l’interrompe pour entamer la 9.ème tour de batte. Après avoir terminé le 9ème manche, Hill a abandonné un coup de circuit pour commencer la 10ème manche pour perdre la partie.
Il y a eu 55 matchs où les lanceurs ont été sans coup sûr jusqu’à 26 mais incapables de terminer le match sans coup sûr. Les exemples récents incluent Yoshinobu Yamamoto en 2025, Framber Valdez en 2024 et Alex Cobb en 2023.
—
Par sabermiketrics
10 Comments
What about those hitless through 28 batters?
Jon Bois does sn excellent breakdown of the odds in his legendary analysis of the career of Dave Stieb
The chance of getting a no hitter is actually better than you’d think: 50%. Either you get one or you don’t
you see that point on the right? Thats the Dave Stieb point
The craziest stat is that only 40.1% are hitless through 3 outs
So the batting average with 2 outs in the 9th of a no hitter is .270. The league wide batting average in that time frame is .261. I have no idea if that means anything, but I went through the work of calculating it, so I’m gonna comment it here.
wild that only 50% of outings hitless through 8 turn into a no-no
The fact that nearly 3% of no-hitters that make it through 27 outs don’t convert is the most insane thing here. I thought Rich Hill’s was an anomaly.
Rich Hill was also pulled by Dave Roberts a few starts before his near perfect game when he had a no hitter going.
Am I reading this correctly, that almost 10% of the time that a pitcher is perfect through 27 outs, he doesn’t complete the perfect game? I know the sample size is small, but are there that many instances of the score still being 0-0 after one pitcher has remained perfected through 9 innings?