The data source states I have to say exactly this: « The information used here was obtained free of charge from and is copyrighted by Retrosheet. Interested parties may contact Retrosheet at « www.retrosheet.org ». »
I used python – libraries: matplotlib, pandas.
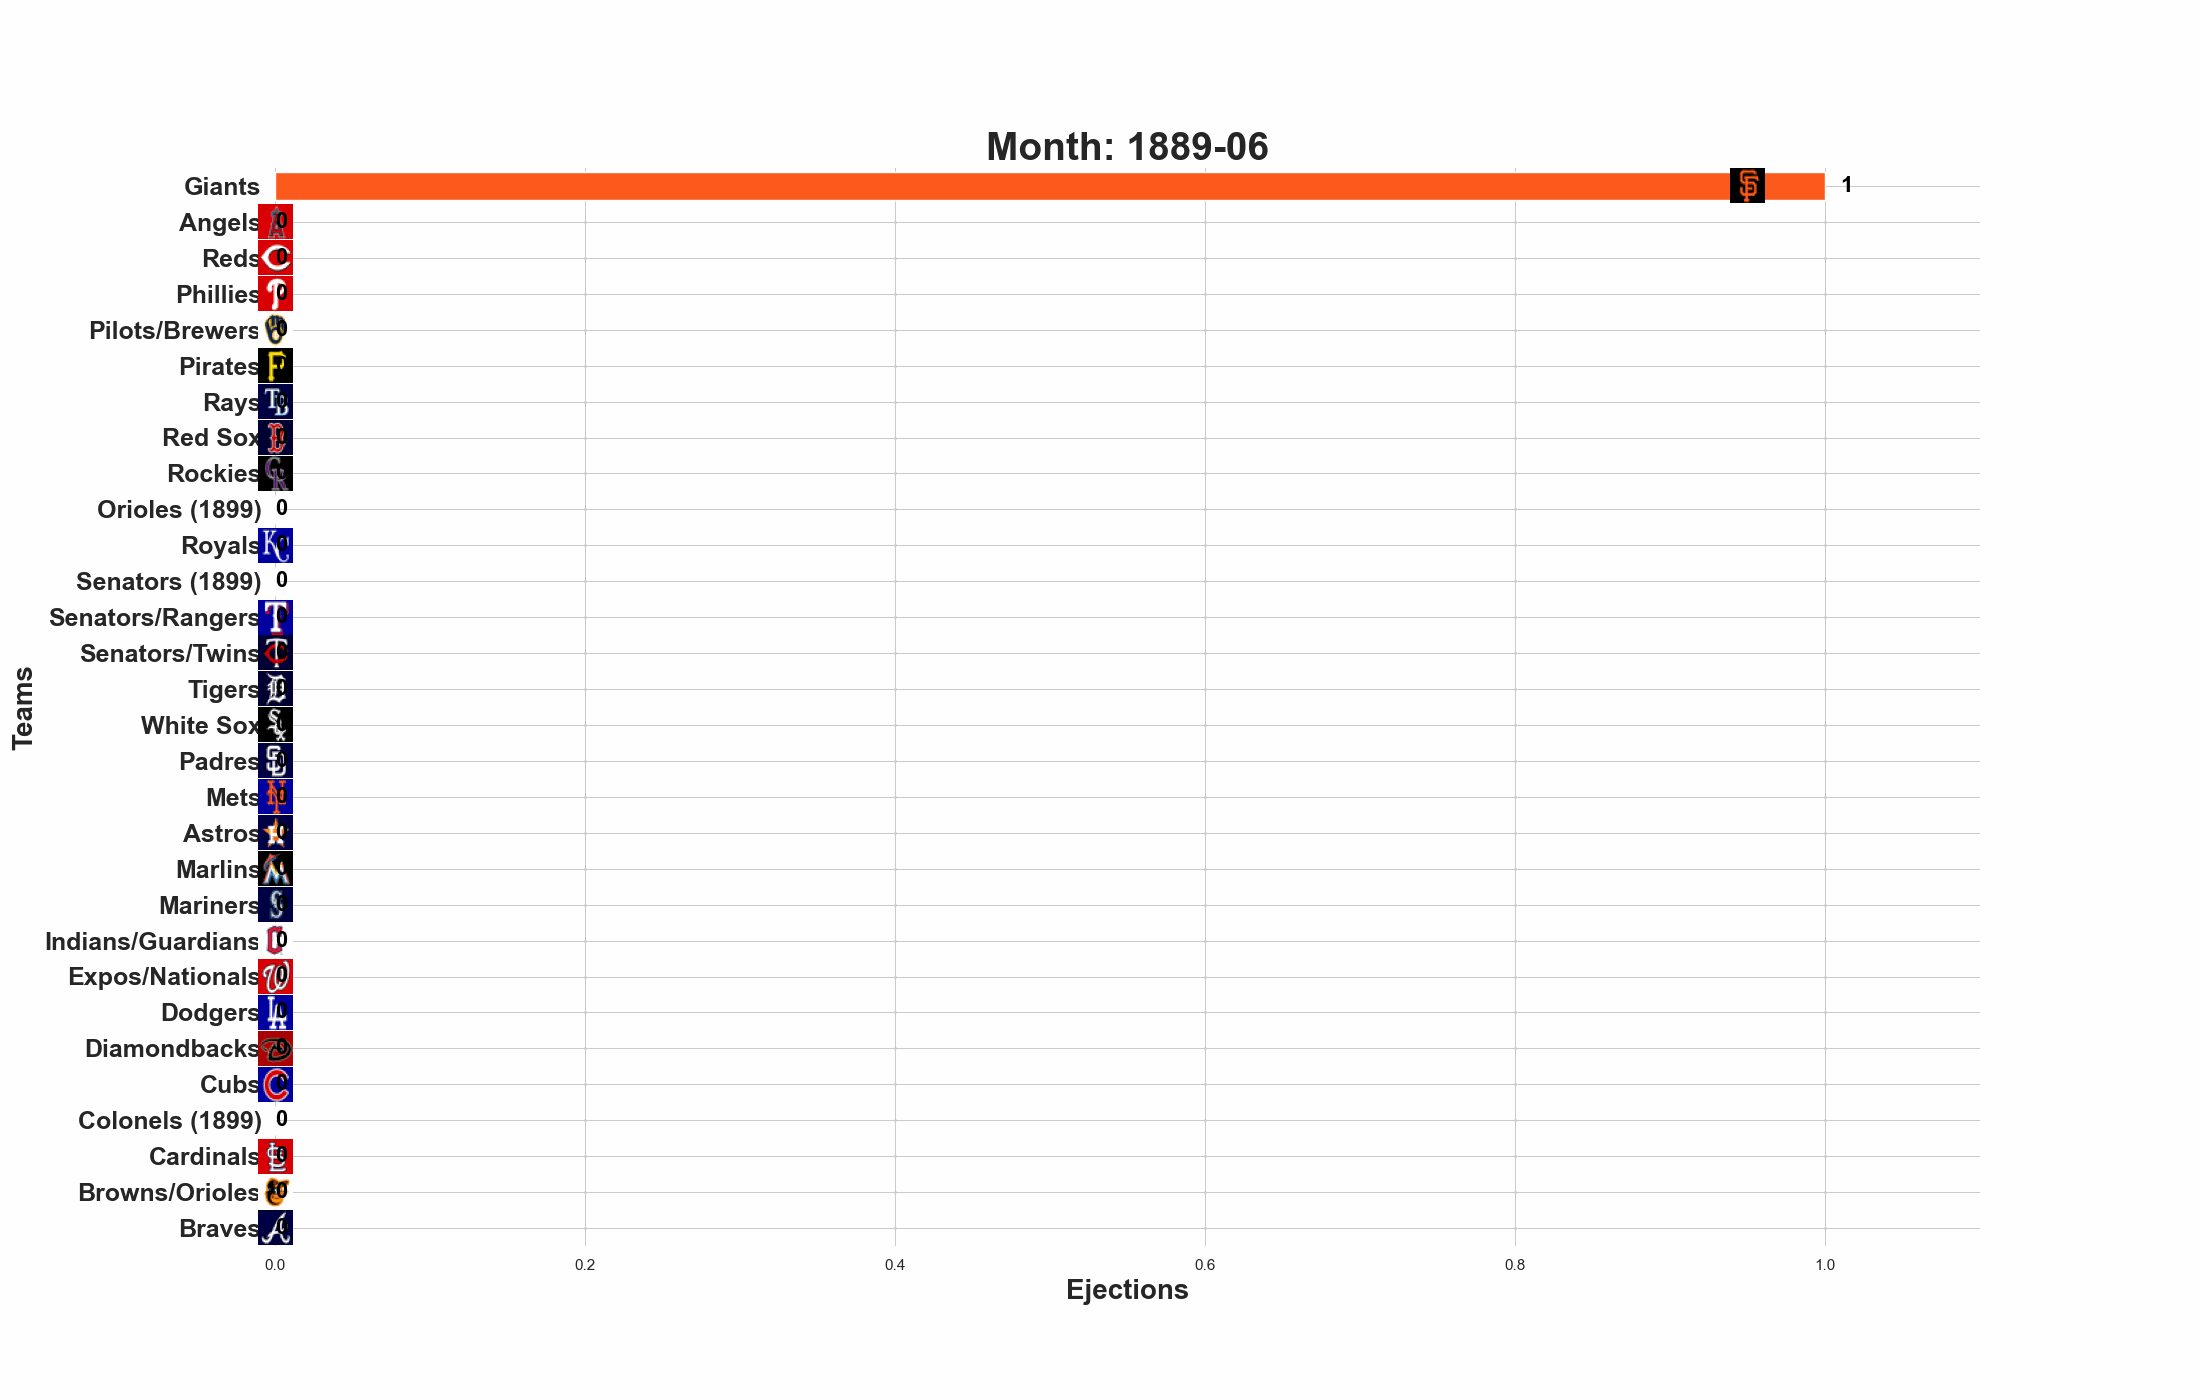
My first viz of these moving bar charts so I am open to suggestions. I had to do a lot of googling on when teams moved cities and if they were affiliated with a current team or not. Biggest confusion was the multiple Washington Senator teams becoming two different expansions (Twins & Rangers).
Also uploaded here: [https://www.youtube.com/watch?v=XF8digQSerY](https://www.youtube.com/watch?v=XF8digQSerY)

1 Comment
The data source states I have to say exactly this: « The information used here was obtained free of charge from and is copyrighted by Retrosheet. Interested parties may contact Retrosheet at « www.retrosheet.org ». »
I used python – libraries: matplotlib, pandas.
My first viz of these moving bar charts so I am open to suggestions. I had to do a lot of googling on when teams moved cities and if they were affiliated with a current team or not. Biggest confusion was the multiple Washington Senator teams becoming two different expansions (Twins & Rangers).
Also uploaded here: [https://www.youtube.com/watch?v=XF8digQSerY](https://www.youtube.com/watch?v=XF8digQSerY)